- Jの画面から次を選びRUNボタンを押す。
Help/Studio/Lab/Plot Package
- Print して読むのも良い
Help/Studio/Showcase/plot
- ツールバーに多彩なデモが入っている。
- Option/ViewDefinition でソースコードが見られる
- ソースコードをコピーして次に貼り付けて実行してみると良い
 testxxx=: 3 : 0
 pd 'reset'
 ......
 pd 'show'
 )
plotのロード
- 実行画面で次のように打ち込んでも、スクリプト画面に次のように書いてもよい
require 'plot numeric trig'
- trigは円関数の定義file
- numericはutility
- 3点セットでロードしておくと便利
dataのplot
- dataを作る sin i:10
  3 7 $  sin i:10
 0.544021 _0.412118 _0.989358 _0.656987 0.279415 0.958924  0.756802
 _0.14112 _0.909297 _0.841471         0 0.841471 0.909297   0.14112
_0.756802 _0.958924 _0.279415  0.656987 0.989358 0.412118 _0.544021
- X;Y \ 2Dplotのdataの型。Xは省略可能で省略すると自動で
i. # Y/(0 1 2 3 ..)をとる
(i:10);sin i:10
 ,.  (i:3);sin i:3
+--------------------------------------------------------+
|_3 _2 _1 0 1 2 3                                        |NB. xaxis
+--------------------------------------------------------+
|_0.14112 _0.909297 _0.841471 0 0.841471 0.909297 0.14112|NB. plot data
+--------------------------------------------------------+
一寸実用向けにsteps関数を用いる。
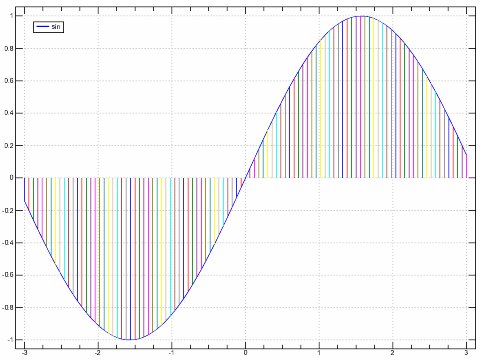
'line,stick' plot sin steps _3 3 100(steps from _3 to 3 divide by 100)

science plot
最近のバージョンでは'line,stick;key sin' plot _3 3 ;'sin'
_3 3 ; 'sin'と区間と関数を指定するだけで足りる。
user定義 関数も当然使える。
Plot のType
\[ \begin{array}{ccc} bar&sbar&fbar\\ line&&\\ stick&&\\ surface&&3donly\\ marker&point&dot\\ \end{array} \] 'bar,line','bar,stick','marker,line'等と指定できる画像のsave
画像が出ている状態で- require 'jpeg png'
- [clip]pd 'clip' clipboadに入る。
- [eps]pd 'eps /temp/plot_01.eps' NB. eps fileを作成する
- [jpg] pd 'save jpg /temp/plot_01.jpg'
- 画像は身近な/tempなどに出した方が早道。
複素数
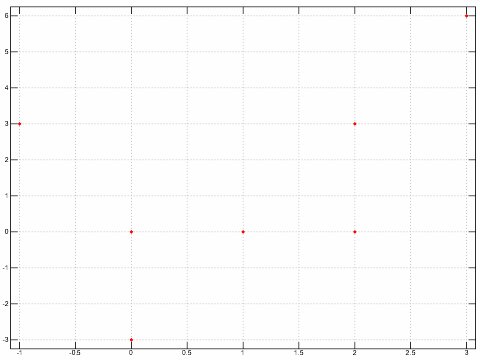
複素数は一つの数でX,Y軸の座標を持っている。2個以上のデータが必要。 (実数も同時に描けるがX軸の指定が出来ないので、値をX軸上に描く。)'marker' plot 3j6 2j3 _1j3 0j_3 0 1 2

複素数をGraphicsに積極的に活用したのが
Presentation用の画像
- 明示型でpd driverを用いてプログラムする。
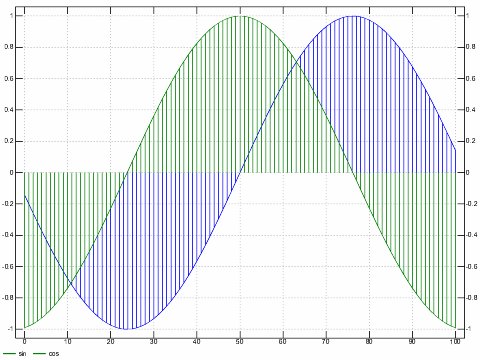
- Exampleを上げておく。y2axisを用いた本格的派。
plot_example=: 3 : 0
pd 'reset'      NB. or new
pd 'type line,stick'
pd 'keypos open bottom'
pd 'keystyle open horizontal'
pd 'key sin cos'
pd 'color blue'
pd sin steps _3 3 100
pd 'y2axis'
pd 'color green'
pd cos steps _3 3 100
pd 'show'

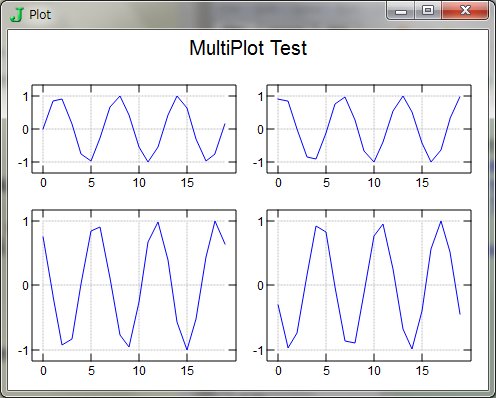
- さらに画面を分割したもの。
DATX=: 4 20 $ sin i.100

plot_test0=: 3 : 0
pd 'reset'
pd 'multi 2 3 ,2 2 '
pd 'title MultiPlot Test'
pd  y
pd 'show'
)

- multi は複雑
これで4個描く、 multi 1 1,1 1 で等倍 - (multiはJ8で仕様が簡略化され、互換性は失われているようだ)